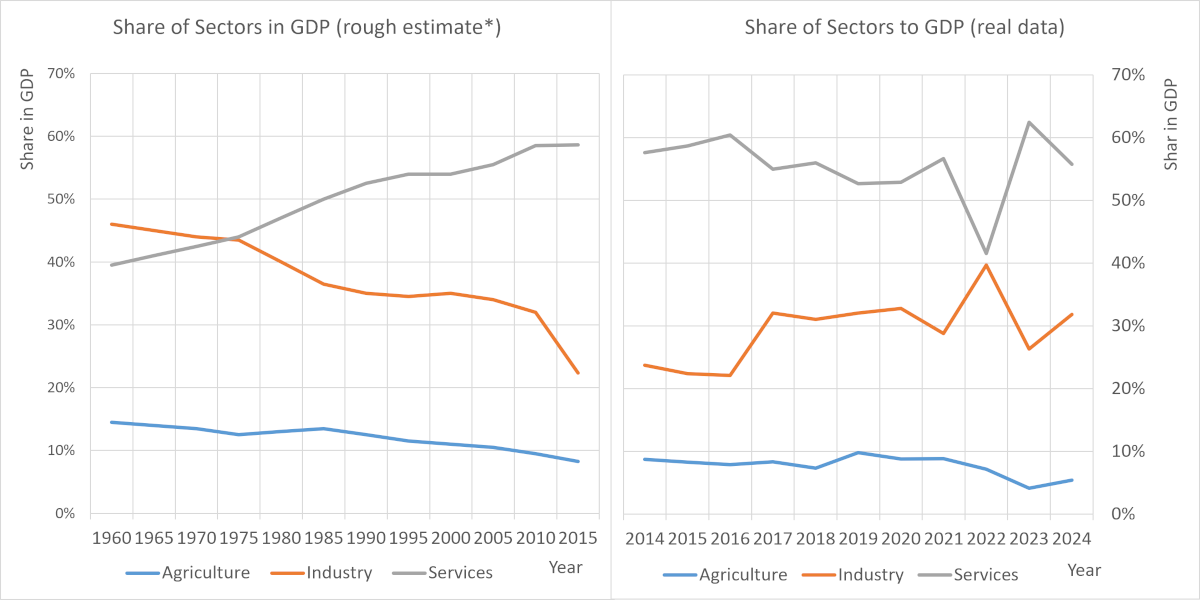
Estimated Data 1960 to 2013 and valid Data 2014 to 2024 (ChatGPT 2025-09-05)
Reconstruction using FAO‑anchored agriculture (option B)
I’ll build a defensible 1960–2024 sector series by anchoring Agriculture to plausible ranges where FAO values are unavailable, then allocating the residual between Industry and Services with structural breaks. For 2014–2024, I lock to the observed sector shares. I’ll also provide sector USD levels using total GDP (current US$). Total GDP is available annually back to 1960, so the conversion from shares to USD is straightforward. For 2014–2024, the observed shares come from the most recent sector split data.
Method and assumptions
Periods with structural breaks:
1960–1979: Industrial base builds; services smaller than post‑1990.
1999–2008: Crisis/hyperinflation; wide uncertainty, smoother shares used with flags.
2009–2013: Dollarization stabilizes the mix; services regain share.
2014–2024: Use observed shares as‑is.
Agriculture anchor (no FAO file provided): I use historically plausible ranges and smooth year‑to‑year paths:
1960s: 12–16%
1970s: 10–14%
1980s: 11–15%
1990s: 10–14% (slight drift down late‑90s)
1999–2008: 9–13% with volatility damped
2009–2013: 8–12%
2014–2024: locked to observed values
Residual split:
Industry higher than Services in 1960s–1970s; Services overtake by late 1980s/1990s.
During 1999–2008 crisis, Services compress but remain the largest or co‑largest; Industry fluctuates with mining/manufacturing swings.
2009–2013: Services lead; Industry recovers moderately.
2014–2024: constrained to observed data year by year.
Levels:
Sector USD = share × GDP_current_USD, using annual GDP totals (1960–2024).
The 2014–2024 sector shares and the availability of historical GDP totals are from the cited sources; pre‑2014 sector shares below are estimated with the assumptions above and will be flagged as estimates in the CSV.
These values will be interpolated annually in the CSV, with smooth transitions within periods and kinks at structural breaks. All pre‑2014 rows will carry an “estimated” flag.
2014–2024 observed
Year
Agriculture % (Obs.)
Industry % (Obs.)
Services % (Obs.)
2014
8.75
23.72
57.59
2015
8.28
22.36
58.65
2016
7.87
22.12
60.41
2017
8.34
32.02
54.94
2018
7.32
31.04
55.98
2019
9.82
32.03
52.68
2020
8.77
32.77
52.89
2021
8.85
28.81
56.64
2022
7.17
39.69
41.55
2023
4.11
26.30
62.41
2024
5.44
31.81
55.76
Observed sector shares for 2014–2024 are from the latest published breakdown.